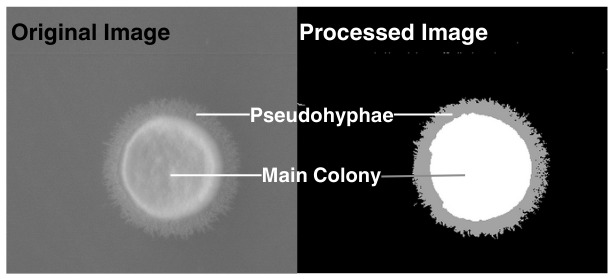
Pipeline illustration of Eclipse 2.0: Pseudohyphal growth (%) is calculated using the number of pixels in pseudohyphae segments divided by the number of pixels in the main colony segment.
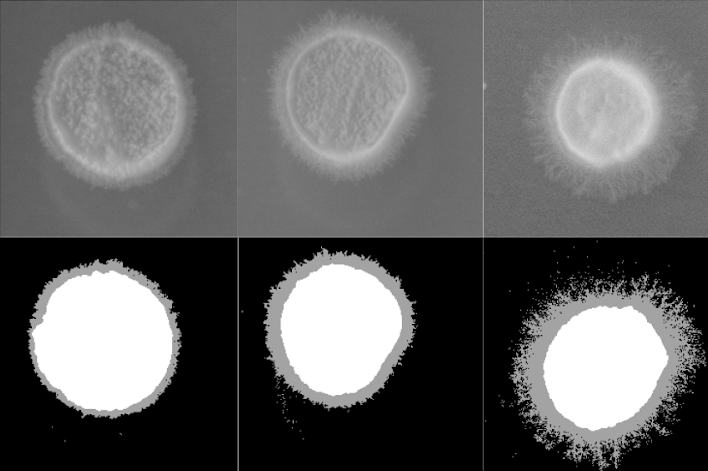
Pseudohyphal growth (%) from left to right: 24.76 %, 48.25 %, 95.10 %
PSH was screened using solid agar with synthetic low-ammonium dextrose (SLAD) 2X medium (2% dextrose, 2% agar, 0.34% yeast nitrogen base without amino acids or ammonium sulfate, and 50 µl of 1M ammonium sulfate) in OmniTrays to create a nitrogen-limiting condition. The SLAD plates were imaged after 5 days of 30 C incubation using an Epson Expression 11000 XL scanner. Each image was split into 96 images for further analysis. The SLAD plates used to screen PSH were washed in order to analyze IG.
PSH images were classified as PSH or non-PSH using a convolutional neural network model. The extent of PSH was then quantified using a computational pipeline.